Generate maintenance reports
Learn how to generate iCenter maintenance reports and filter data.
iCenter Maintenance reports provide information to help you manage planned maintenance service requests, monitor service activity, and measure performance. You can select from a list of iCenter maintenance reports available for your facility in the Report launcher. The selected report is displayed in a Report view, in which you can specify report parameters or filters.
To generate maintenance reports:
- On the menu bar, click Report.
- In the Report launcher, load the desired maintenance report by clicking its title on the left.
 Tip: Report categories are listed on the right of each report entry.
 - In the Report view, select the assets to include in the report:
- Select one or more imaging assets (Service Activity report[ regional availability] only):
- Click the modality circle for each asset you want to include in the report.

After you select an asset, the modality label is replaced with a white checkmark in a green circle.
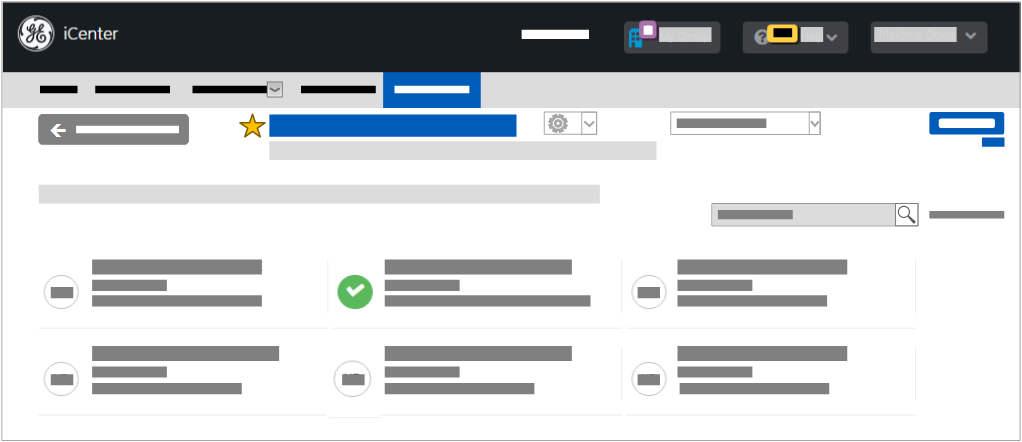
To clear a selection, click on its green circle. Clear all selections to return to the full list.
Tip: If this is a group of assets you will want to regularly view maintenance data for, Create a report favorite for this selection page.OR
- Use the Search box
 to locate a specific asset.Note: Search results depend on the facilities you have access to and any groups currently selected in the Facility Groups switcher (for details, see topics Get started with My Account and Switch facilities or groups).
Note:Only equipment that meets the following criteria will be displayed in this asset selection page:- It is associated to the currently selected Facility Groups
- It has transmitted maintenance (IPM) data to iCenter in the last 48 months
- It has current coverage (active contract and/or warranty)
- Click the modality circle for each asset you want to include in the report.
- Specify the date range:
- Hover the mouse pointer over the current Start Date or End Date and then click the Edit icon.
 Note: By default, the End date is set to today's date and Start date is set to 3 months ago.
 - Click the field.

- In the Date Picker, specify the desired start date or end date:
- Use the left arrow next to the Month to display the previous month, or the right arrow to display the next month.
- Click on the desired day. The selected day is highlighted in blue.
- Click Confirm to confirm the specified date.

or Discard to discard your change and revert to the previously specified date.


- Hover the mouse pointer over the current Start Date or End Date and then click the Edit icon.
- Select one or more imaging assets (Service Activity report[ regional availability] only):
- Click Generate report (Service Activity report only).
 Generate report turns from gray to blue when you have specified sufficient parameters to generate the report.The way the generated report is delivered depends on the report:
- The Planned maintenance schedule, Service activity summary, Service performance analysis reports are displayed in the content area of the Report view.

OR
The Service Activity report is downloaded as a .pdf file, which you can open in Adobe Acrobat *.
 Tip: The data provided in iCenter reports is provided for informational purposes. Click the info link below Generate to view the legal disclaimer covering intended usage of report data. For details on working with a generated report, see other topics in this Navigate reports section.
 - The Planned maintenance schedule, Service activity summary, Service performance analysis reports are displayed in the content area of the Report view.
- For reports displayed in the Report view, analyze the report data (for details, see topic Visualize data in reports) and apply any desired filters to limit the data displayed in the generated report.
 Tip: For reports that have multiple tabs, the report opens at the first tab with the visualized metrics. Click tabs to move to other data visualizations in the report.
The available filters depend on the report, but the following types of filters can be specified for maintenance reports:
Filter Example Description Used in reports Classification 
- Type a value in the entry field.
- Click the date list and then select either Include Values or Exclude Values as appropriate (the selected option is indicated by a blue ball). Tip: This filter is also displayed under an Option List (see below) when you hover the mouse pointer over a selected value.
Completion Date 
- Leave the default
or
- Click the date list and specify the desired date ranges:
- First click one of: Years, Quarters, Months, Weeks, Days.
- Then narrow this by clicking one of: Previous, This, or Next time frame or Month to date.
The specified date range is displayed at the bottom of the Completion Date box.
Date range - Start
- End
Date picker

- Leave the default of:
- Start: Current date -3 months
- End: Current date +3 months
or
- Click in the Start or End field and then in the displayed date picker select the desired date.
Option List - Facility
- Modality
- Department

- Click the desired items in one or more filter lists to display only data for the specified items in the report.
In each filter list available for a report, you can select a single item or multiple items as described in the FAQ section at the end of this topic. Selected filter items are highlighted in blue.
Tip: Report data is color-coded for selected filters in the generated report, with the filter label and item count displayed in the top left corner. - If desired, you can view or further narrow your filter selections by hovering the mouse pointer over a highlighted item to display a tooltip indicating the number of filter items selected and providing the following toolbar buttons for modifying the selected filter items:
- Keep only: Display only the items selected in the filter list; remove any other items.
- Exclude: Display all but the item selected in the filter list; remove this item.
- Sort Ascending: Sort the selected filter list items in ascending order (A-Z, 1-10).
- Sort Descending: Sort the selected filter list items in descending order (Z-A, 10-1).
Search 
Type in a value to search for in the generated report. Status: - Scheduled
- Started
- Completed

Click the desired filter to display only data with the selected status. - When you are finished viewing a report in the Report viewer, click Back to report list.

FAQs
- How do I select more than one item in a Select Box?
- To select multiple consecutive entries, click the first item, hold down the Shift key, and then click the last items to be included.
- To select multiple non-consecutive entries, click the first items, hold down the Ctrl key, and click any additional items to be selected.
- Why are no system ID entries displayed in the Select box?
The system ID must be associated with your user account in order to see the system ID in the Report menu. If no entries are displayed, contact your GE Support representative for assistance.
- What reports are available?
iCenter provides several maintenance reports. The specific reports available to you depend upon your region[ regional availability] and profile settings. For details, see topic Visualize data in reports.
- How can I remove filters from a report?
To revert changes you made while viewing a generated report, click outside of the graph and filters to reset the filters to their defaults.
- How do I know what the data in the report means?
Topic Visualize data in reports provides the information you need to turn the report data into meaningful analytics.