Monitor planned maintenance
Learn how to monitor equipment service schedules in the Planned maintenance schedule report.
The Planned maintenance schedule report provides a schedule of completed, started, and scheduled service for equipment in your inventory.
This report is intended for Biomedical Engineering Managers, Clinical Services Directors, and others responsible for equipment servicing.
The information in this report is useful for demonstrating compliance with planned maintenance of medical equipment according to the manufacturer's schedule as specified by the Centers for Medicare & Medicaid Services (CMS) as well as any local requirements. Compliance to the planned maintenance schedule is frequently the subject of audits. This report provides an efficient way to provide evidence that planned maintenance was performed on equipment by the required dates.

Data definition
- Cover
- PM planning (this is the default tab when the report opens)
- Disclaimer
This tab identifies the report title and generation date.
This tab indicates how complete iCenter data is for specified time periods.
| Data label | Data definition |
|---|---|
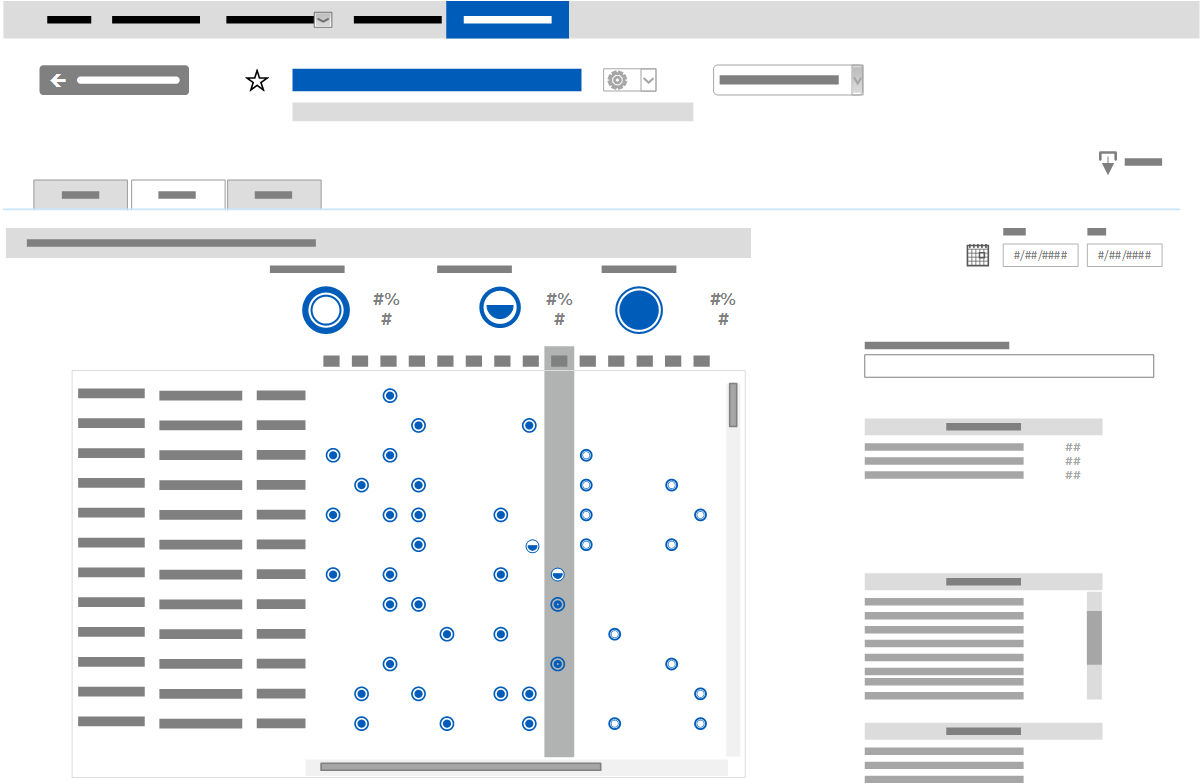
| Planned Maintenance by Equipment | Calendar heat map chart that displays data for scheduled, started, and completed planned maintenance (PM) stats of active equipment over a 7-month period. This time span covers the current month, the previous 3 months, and the following 3 months. Note:
The following equipment is not represented in the report:
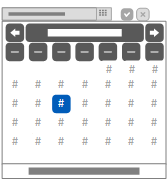
At the top of the report, either leave the default 7-month date range, or click in the Start and End fields to change the date range: 
At the top of the chart, view the percentage and totals to the right of each PM status filter:

Click a PM status circle to filter the data displayed in the scheduling calendar with that status. The selected status circle is displayed in dark blue, and the Facility, Modality, and Department filter totals in the Report filters section on the right side of the report are adjusted to reflect the applied status filter. Click that status filter again to clear the filter and display all of the original report data. Tip: The total percentage and count values displayed to the right of the status filters do not change when one PM status filter is applied. The totals are still valid; it is just the equipment of the non-selected status is not displayed in the scheduling calendar.
The scheduling calendar contains columns for Equipment ID, Equipment Description, and Modality. Each row indicates the PM status for the specified active equipment using the PM status indicators. View these circles in the grid to identify the month that planned maintenance activities took place. The current month is emphasized in gray. Hover the mouse pointer over an individual circle to display a tooltip providing details on that activity (for details, see the iCenter data fields reference):
Click a specific circle or select multiple blocks in the grid to display details only for the selected equipment in the report filters on the right. Click elsewhere in the grid to clear the selection. |
This tab contains the legal disclaimer governing usage of iCenter data provided in this report.
Report filters
This section lists the filters you can specify to determine the data displayed in this generated report. Selecting a value in one of these filters affects the data displayed in the other filters as well as the report charts. For instructions on how to apply report filters, see topic Generate maintenance reports.
| Filter name | Description |
|---|---|
| Date range | Click in the Start and/or End fields to change the date range from the default of 7 months. |
| Search Equipment ID | Enter a unique iCenter identification code (or a partial ID) to display only data for the specified equipment. For tips on using a search box, see topic Search for items in a view. Tip: This is useful for locating the specified equipment when responding to an audit query.
|
| Facility | Click the desired iCenter facility name to display only data for that facility. The number of PM activities is indicated on the right of each facility. |
| Modality | Click one or more categories of equipment assigned in iCenter to display only data for that facility. |
| Department | Click the desired Using department name to display only data for that department. The number of PM activities is indicated for each specified department. |
FAQs
Can I print this report or share it outside of iCenter?
- You can export iCenter reports to other formats, which you can view and print from third-party productivity software.
Are my generated report settings saved if I mark the report as a favorite?
- You can Save a custom report if you want to view the report with these settings again. You can mark the report as a favorite if you want to create a home page tile for it. Note: Any filters you applied to report are not saved when you mark a report as a favorite.
