Monitor imaging asset fleet service quality
Learn how to monitor imaging equipment fleet service quality and responsiveness in the Business Review dashboard business review report.
The Business Review dashboard report provides metrics on asset distribution and service metrics to support inventory planning and periodic reviews[ regional availability]. It provides data on equipment with current by GE contract or warranty coverage.
This Business review report is intended for Account Executives responsible for asset performance metrics.
The information in this report is useful for visualizing the distribution and availability of imaging assets as well as the responsiveness of service providers. You can use the report to plan your inventory investments, ensure equipment meets performance specifications, and monitor conformance to service agreements.

Data definition
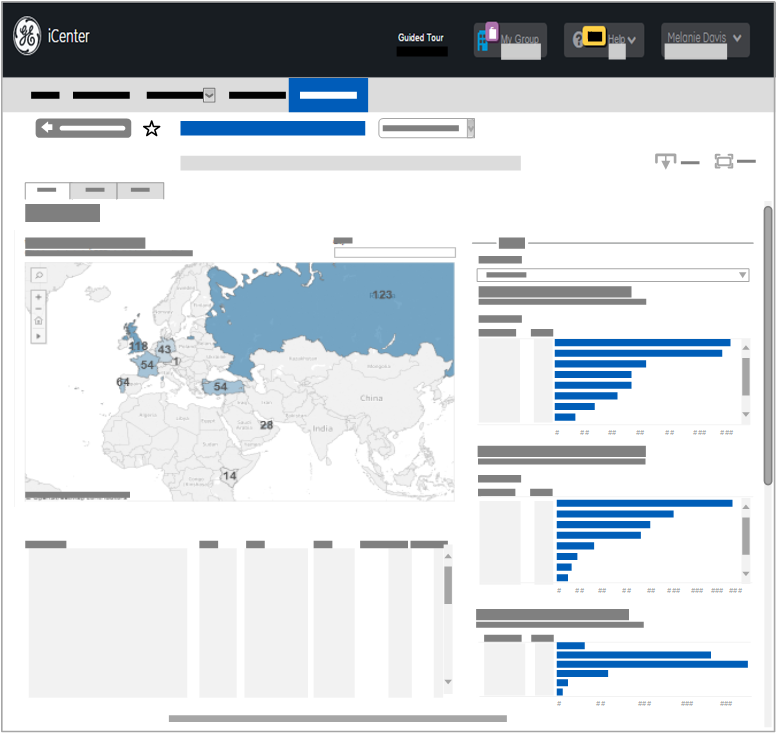
Inventory Management. This tab, which the report opens to, provides a high-level overview of the geographic location of your assets, which you can filter by contract, country, modality, and age. You can use this information to plan your inventory investments. For details of the labels in this section of the report, Consult the iCenter data dictionary.

| Data label | Data definition |
|---|---|
| Where are my assets? | A map that shows countries for which equipment data is available based on the values in the selected filters (for details, see section Report filters). View the number of imaging assets in each country. The number of assets appears on the map and on each of the distribution filters on the right. Click a country to highlight it in this map and to display data only for that country in the chart below. CTRL+click multiple countries to highlight and display only their data. Click elsewhere in the chart to display all data again. Hover the mouse pointer over a specific country to identify the country name and the number of imaging assets there:
<Country code> has <x> |
| Asset list | A Summary table that lists for the selected countries the following asset details:
|
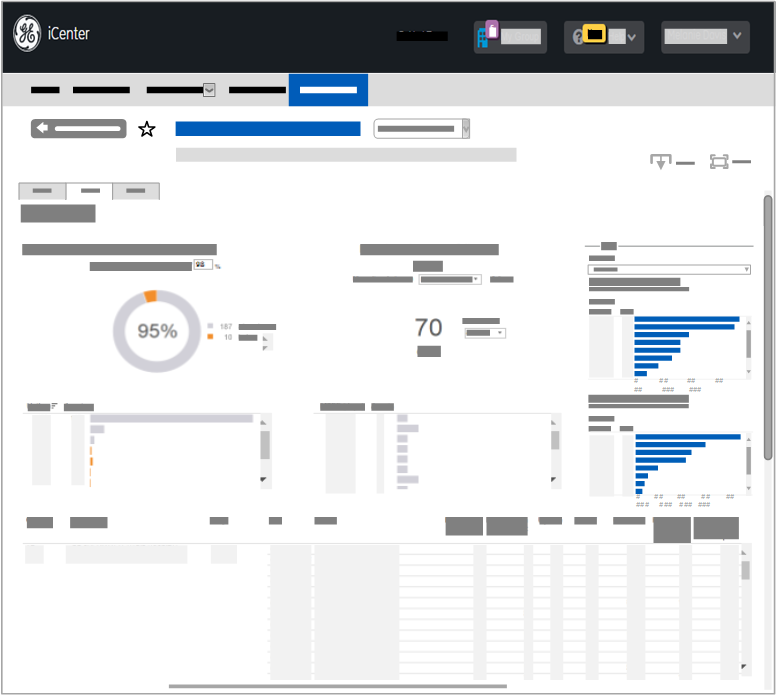
Reliability. This tab provides data to view uptime targets and failure metrics, which you can filter by contract, country, and modality. Uptime target metrics are useful for measuring the availability of assets during business operating hours to ensure the equipment meets its performance specification and service agreements. Failure metrics on the execution of planned activities (PM, FMIs) and volume of service calls, are useful for detecting patterns by location or modality. Uptime data is taken directly from the source system; iCenter does not perform uptime calculations for this report.

| Data label | Data definition |
|---|---|
| How many assets meet uptime target? | In the Assets meeting target of <x> % field, view or edit the specified target. View the doughnut chart providing uptime metrics:
View the number of assets meeting the uptime target on each of the distribution filters on the right. In the Summary table view a breakdown of the number of assets by uptime percentage. |
| How long between failures? | In the MTBF Mean time between <x> failure drop-down list, select the failure type to analyze:
From the Calculation drop-down list, select the method for determine MTBF. View the number of days since any assets serviced by the selected service provider experienced the specified equipment failure time. |
| Asset list | In the Summary table view, for the assets included in the report, the following reliability metrics:
|
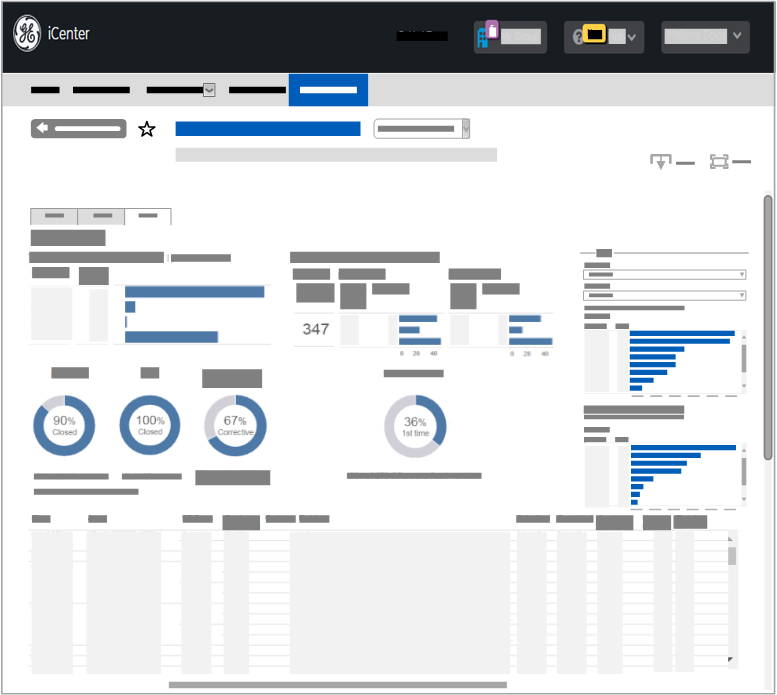
Service. This tab provides data to view service activity types and repair times, which you can filter by contract, availability, country, and modality. This data is useful for measuring the responsiveness of the service provider to fix problems, to ensure that assets are being serviced in a timely manner and in accordance to with the servicing contract.

| Data label | Data definition |
|---|---|
| What is the service activity? | In the Bar chart, view the number of service requests (SRs) within each SR type over the past 12 months:
In the doughnut charts below, view service activity metrics:
|
| How quickly are assets fixed? | In the Bar charts, view metrics for time to fix all SRs broken down by equipment failure type (Hard down, Partial down):
In the doughnut chart below, view repair activity metrics:
|
| Asset list | In the Summary table view, for the assets included in the report, the following SR metrics:
|
Report filters
You can apply the following filters on the right side of the report to determine the data displayed in the sections of this generated report. To clear age range filters, click away from the age bars. For instructions on how to apply report filters, see topic Generate business review reports. For descriptions of the labels in this report, see topic iCenter data field reference
| Filter name | Description | Displayed in tab |
|---|---|---|
| By age | Select one or more 5-year ranges to view the distribution of assets by age. |
|
| By availability | Click the drop-down list and select the equipment availability state to ensure the equipment meets its performance specification and service agreement targets during business operating hours:
|
|
| By contract | Select one or more service agreements associated with assets in the current facility group to display data only for those contract types. |
|
| By country | View the number in the Assets column to identify how may assets you operate in each country. Select one or more country bars to display data only for those countries. |
|
| By modality | Select one or more imaging modalities to identify how many assets you operate for each. |
|
| City | Type in a city name and then click the drop-down list and select whether or not to display data for it in the map:
Note: If assets are all within a single city in a country, no city names are displayed.
|
|
FAQs
Can I clear filters I set on another tab?
- The filters you set on one tab are applied to the other tabs in this report. If you wish to clear previously applied filters, close and regenerate the report.
Why can't I see this report in the Report launcher?
- The reports you can view depend on your user profile. This report is displayed only for user profiles in regions where this feature is available [ regional availability].