Analyze raw utilization data
Learn how to analyze raw utilization data in the Utilization Excel export report.
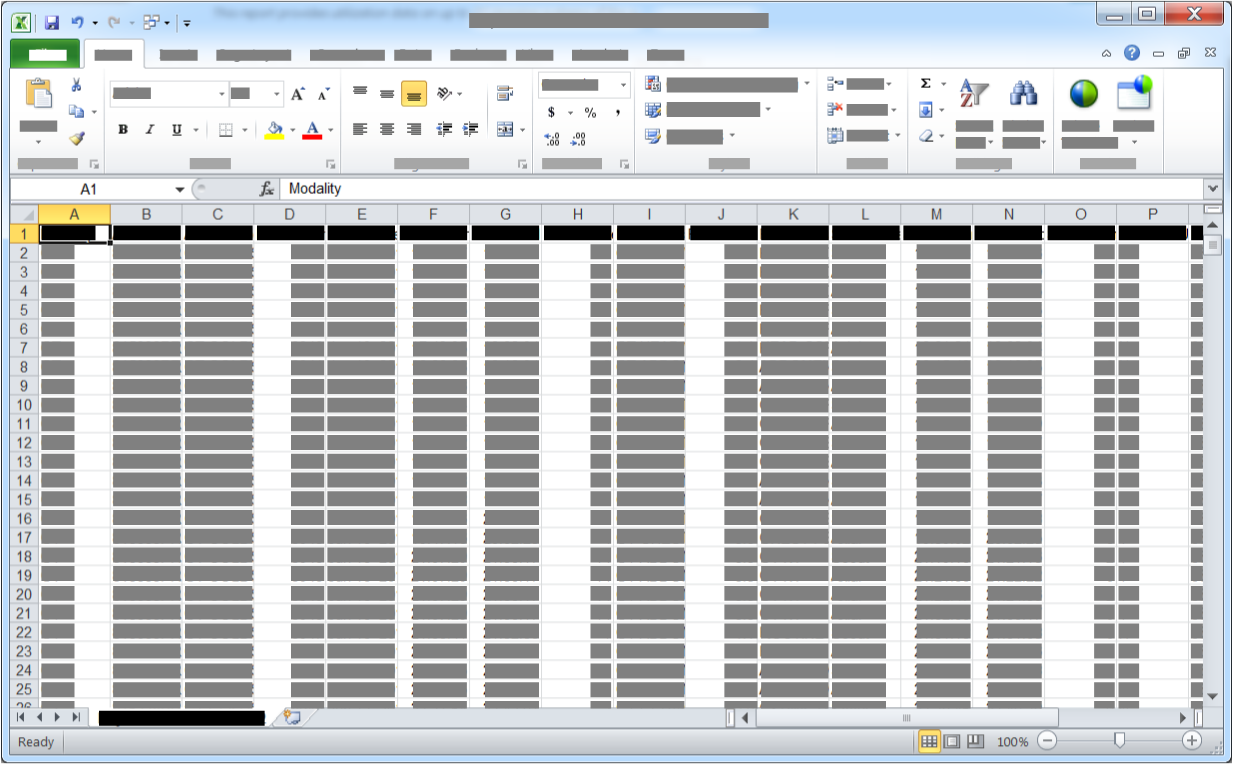
The Utilization Excel export report provides utilization data on up to 20 imaging systems in the same modality.
This report is intended for Data Analysts, Data Scientists, internal 6 Sigma/Lean Team members, and others interested in performing more detailed analysis on iCenter data.
The information in this report may fill a variety of needs beyond the data evaluation and reporting provided in iCenter. For example, you might want to filter by specific days of the week or times of the day to analyze performance during particular shifts. This report provides raw data that you can analyze according to your needs.

Data definition
This generated report is downloaded as a .csv file, with the file naming convention ExportExcelyyyymmdd (for example, ExportExcel2015022.csv for a file exported on May 22, 2015).
Once downloaded, you can open this .csv file in a spreadsheet program such as Microsoft Excel *.
- Asset description
- Coil type
- Contrast used
- Equipment ID
- Exam date
- Exam description
- Exam end time
- Exam number
- Exam start time
- Exam time (min)
- Modality[ regional availability]
- Patient age[ regional availability]
- Patient ID
- Protocol ID
- Protocol name
- Radiologist[ regional availability]
- Referring physician[ regional availability]
- Series description
- Series end time
- Series ID
- Series start time
- Series time (min:sec)
- Technologist[ regional availability]
- Total series time for exam (min:sec)[ regional availability]
- Utilization report
- Exam date
- Exam start time
- Series start time
- Equipment ID
Report filters
There are no additional filters to specify for this generated report. As it is delivered in spreadsheet format, you can edit and save the data as you would any other spreadsheet file.
When you generate the report, you can specify up to 20 Equipment IDs, which all must be from same modality (that means, you can't download a joint report for CTs and MRs; you will need to do separate downloads). When you generate the report, you also specify the time span (you might find the previous 6 months is a reasonable amount of data to analyze).
For instructions on how to apply report filters, see topic Generate utilization reports.